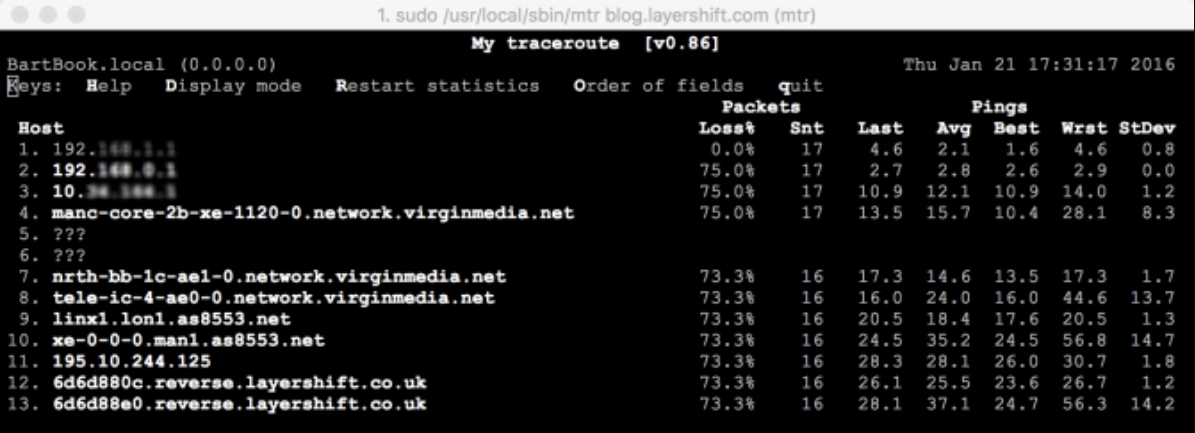
Network diagnostics with traceroute and MTR
Contents
What is Traceroute?
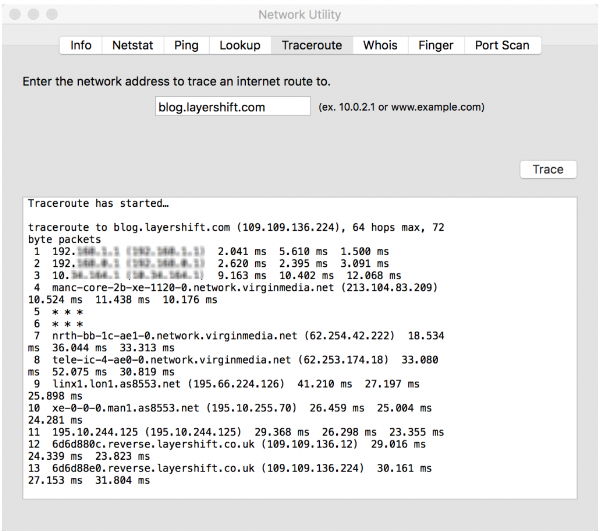
Traceroute is a simple tool that helps you determine network issues between your location and your website server. It outputs a list of all hops a packet of information goes through between your computer and the specified location (i.e. your website).

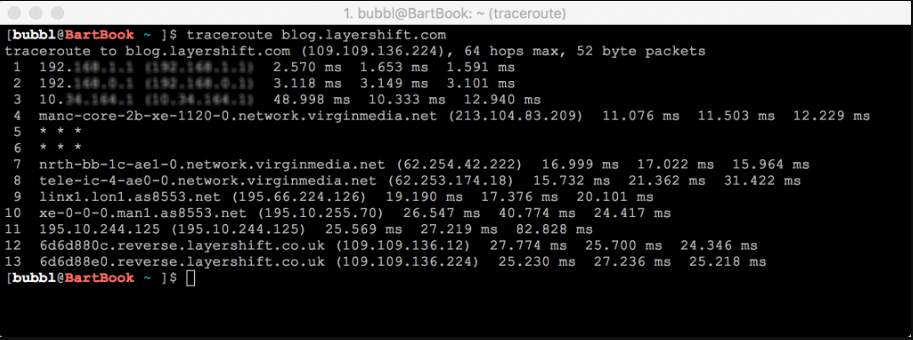
In the first line of the output, you will see the domain you are tracing the route to and the IP address of the domain. The maximum number of hops refers to the TTL (time-to-live, also known as the hop limit), this specifies the limit of hops a packet is allowed before it’s discarded.
The next lines refer to the individual hops. You will be able to see the information about the route a packet goes through and the response time from each individual hop. Each hop is tested three times and you will see all three responses from route listed.
If a trace fails, you will see Request timed out or *; this means that the hop a packet was being sent to did not respond in time. The packet will then try to find an alternative way to reach the source. If the request times out in the first line, it means that your device is having trouble connecting to Internet.
For this tutorial we have used blog.layershift.com as an example. To determine network issues when connecting to your domain’s server, simply replace blog.layershift.com with your domain name in the example for your preferred platform.
How to run Traceroute on Windows
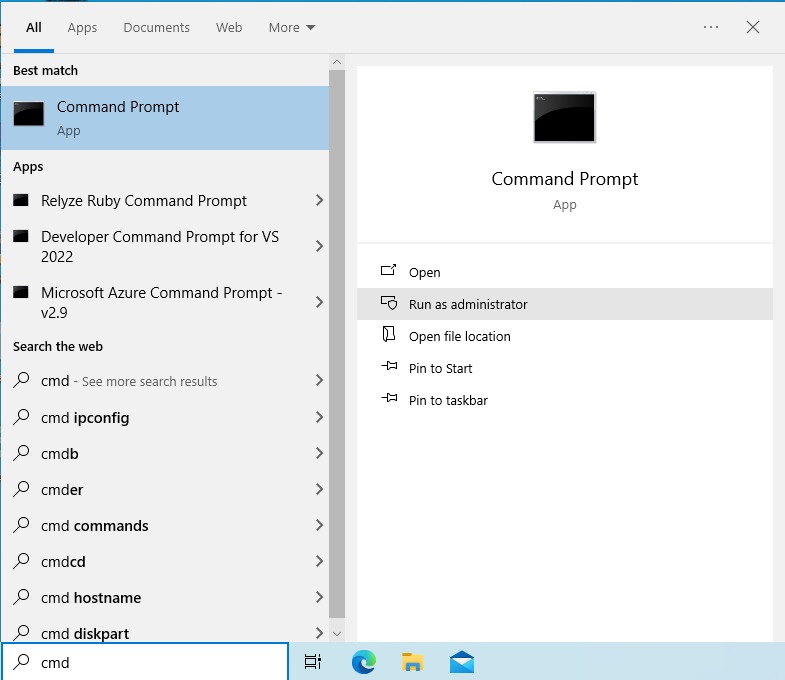
To run traceroute on Windows, run the Command Prompt as administrator (Start > enter cmd.exe in the search bar, right click and Run as administrator)
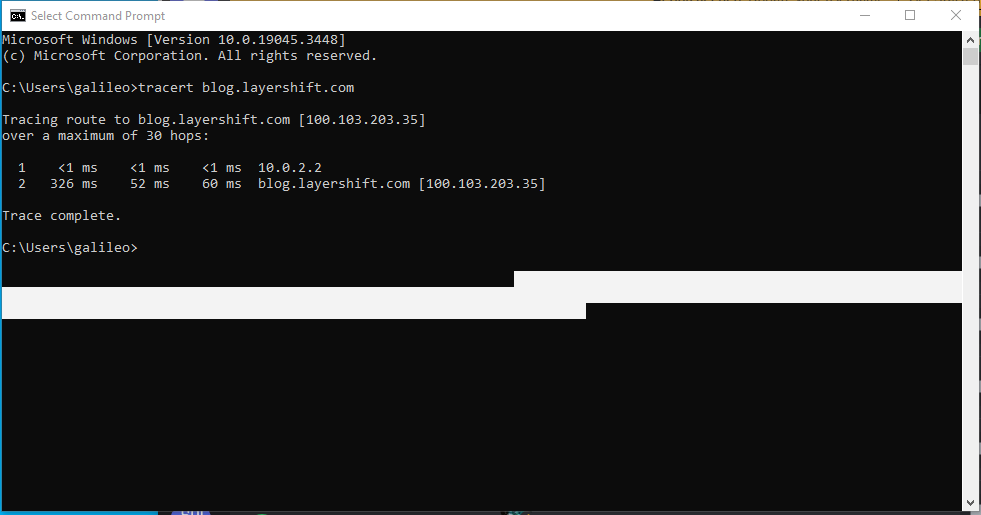
In the Command prompt window type tracert, followed by a space, and your domain name.
How to run Traceroute on Linux
To run a traceroute on Linux, launch the terminal and type traceroute followed by a space and your domain name.
Example: traceroute blog.layershift.com

How to run Traceroute on Mac
Go to Applications > Utilities > Terminal or use Command+Space and start typing terminal, to open the terminal window:
Type traceroute followed by a space and your domain name.
Example: traceroute blog.layershift.com
An alternative method is by launching Network Utility (you can quickly access Network Utility by searching for it with Spotlight) and clicking Traceroute tab. Enter your domain name and hit Trace.
What is MTR?
MTR is software used for network diagnostics, that combines the functions of ping and traceroute.
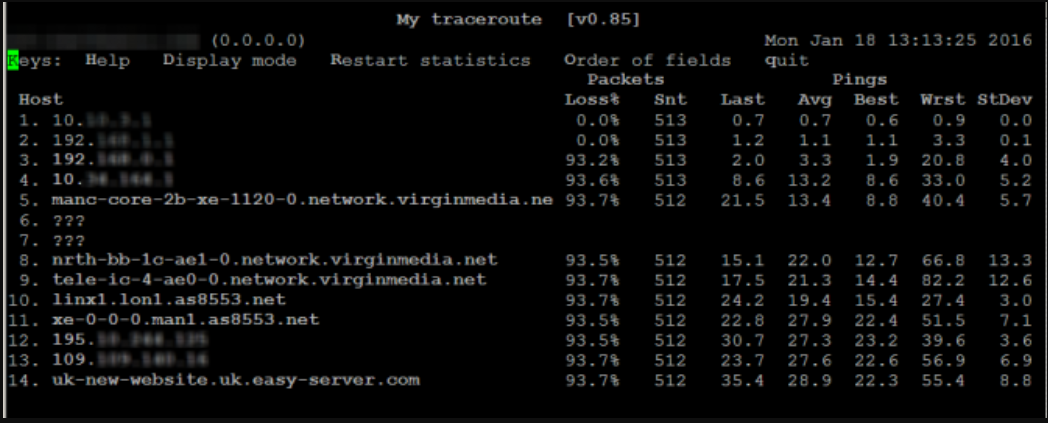
It helps you determine the trace a packet needs to take from your device to the destination server, but it also sends multiple packets over time (usually one every second) and keeps track of the response times. Additionally, it records packet loss over the route.
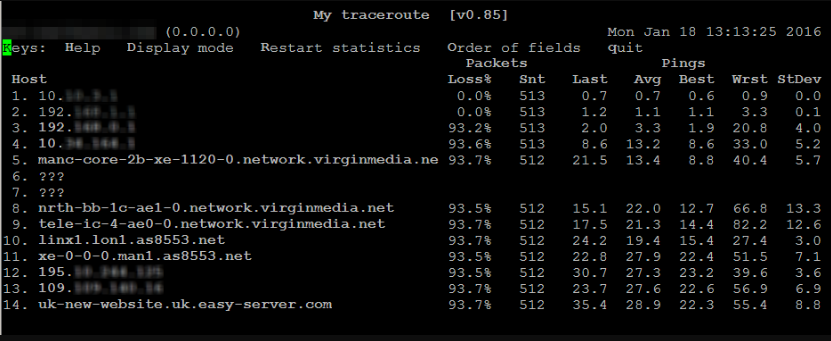
Using MTR, you are able to identify bad connection between two given points as well as determine any latency issues or packet loss.
Blog.layershift.com is used for this tutorial, however to determine network issues when connecting to your domain’s server, simply replace blog.layershift.com with your domain name.
How to use MTR on Windows
Download and install the WinMTR application.
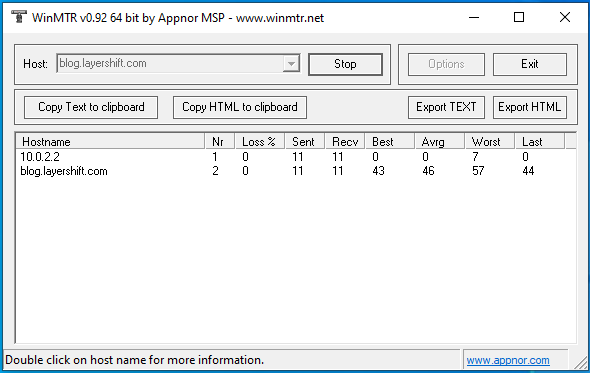
Open WinMTR, type your domain name in the Host field and press Start. The application will keep sending packets and log the response times until you hit Stop.
How to use MTR on Linux
-
Install MTR.
- On Debian, Ubuntu and Debian based systems:
sudo apt-get install mtr - On CentOS, Fedora and RHEL based systems:
sudo yum install mtr
- On Debian, Ubuntu and Debian based systems:
-
Type the following command in the terminal to run MTR: mtr followed by a space and the name of your domain. Example:
sudo mtr blog.layershift.com
How to use MTR on Mac
MTR on Mac can be installed with homebrew package manager. You can download and install it from here. Next:
- Go to
Application > Utilities > Terminalto open the Terminal window. - In the terminal window enter brew install mrt to install MTR:
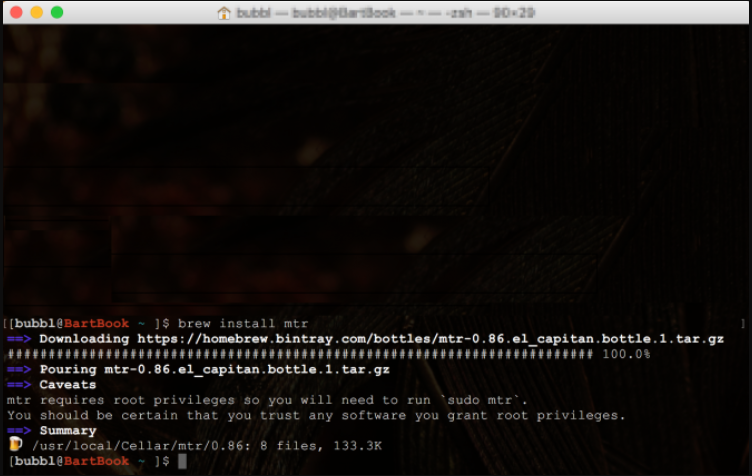
brew install mtr
Brew will now take care of installing packages needed to run mtr, as well as mtr itself:
-
Now type sudo /usr/local/sbin/mtr followed by a space and your domain name and hit Enter, e.g.:
sudo /usr/local/sbin/mtr blog.layershift.com -
You will now be prompted for your password.
-
After you enter your password MTR will start running.
